10 Practical Kubernetes Tips for Day to Day Kubernetes usage
A couple of years ago I wrote a number of articles on how to work with docker. Since that time a lot has changed in the docker and container world. Docker has matured, and provides a large number of interesting features, accompanying tools and lots and lots of other fun stuff. For my last project, though, we moved our docker swarm setup to a kubernetes setup, since that provided us with more control on how to deploy our components.
So in this article, I’ll show some of the stuff I often use in my daily dealing with kubernetes. Note that this is just a very small glimpse into what is possible through the kubernetes CLI.
1. Extending kubectl
A really nice feature of kubectl is that it is really easy to create new commands that wrap the standard kubectl functionality. One of the things I used to do often with kubernetes is list pods, to see if something is started, whether everything is running etc.
~ kubectl get pods
NAME    READY   STATUS    RESTARTS   AGE
pod-1   1/1     Running   0          20s
pod-2   1/1     Running   0          8s
While this works nice, it quickly becomes annoying to type this. We can of course just alias this on bash level, but kubectl also provides an alternative way to do this, by creating custom commands. For instance we can create an kubectl ls command which does the same:
~ kubectl ls
NAME    READY   STATUS    RESTARTS   AGE
pod-1   1/1     Running   0          2m
pod-2   1/1     Running   0          1m
What happens here is that when kubectl encounters a command it doesn’t know, it’ll look for a specific command in the PATH. In this case it’ll try to find the kubectl-ls command. This is in my path and looks like this:
#!/bin/bash

kubectl get pods
Something else which I find myself often doing, especially with a large number of running pods, is grepping the output of the kubectl get pods command. This can be easily written as a custom command like this:
#!/bin/bash

kubectl get pods | grep -i ${1}
And you use it like this:
~ kubectl ls
NAME        READY   STATUS              RESTARTS   AGE
another-1   0/1     ContainerCreating   0          4s
pod-1       1/1     Running             0          8m

~ kubectl grep another
another-1   1/1     Running   0          9s
I’ve noticed that whenever I get annoyed at having to type a large set of somewhat similar commands I just write a simple wrapper, since it is really easy.
2. Kubernetes exec
This is something I guess everybody already knows, but I’ll add it here anyways. When developing new services, or running pods, sometimes we just want to look inside the container to see what is really happening. When doing docker, we’d just run docker exec -ti <container> bash and started working in the container. For kubernetes this is exactly the same!
~ kubectl ls
NAME        READY   STATUS    RESTARTS   AGE
another-1   1/1     Running   0          6m
pod-1       1/1     Running   0          14m
~ kubectl exec -ti another-1 bash
root@another-1:/#
Now you can do anything from the context of that container. Really easy to check network issues, status of running services.
3. Kubernetes get and jq
Just like we’ve got docker inspect we’ve got kubectl describe which provides us information on running resources. While normal describe return information in a readable format, you can also just use kubectl get <> -o json to get information in json format, which makes processing and querying in your scripts easier.
~ kubectl get pod another-1 -o json
{
    "apiVersion": "v1",
    "kind": "Pod",
    "metadata": {
        "creationTimestamp": "2018-12-17T11:03:55Z",
        "labels": {
            "run": "another-1"
        },
        "name": "another-1",
        "namespace": "default"
        "..." : "..."
    }
}
And when we’ve got the json, parsing this and using the output in your own scripts becomes really easy by just using jq:
~ kubectl get pod another-1 -o json | jq '.status.hostIP' -r
192.168.65.3
~ kubectl get pod another-1 -o json | jq '.status.podIP' -r
10.1.0.57
4. Copying data from running containers
Often you can do all you need to do, just by running kubectl exec .... Sometimes, though, it would be really nice if you’ve got the actual data, to play around with. For instance to reproduce some annoying issue, or get some relevant data to work with during development. Luckily kubectl also provides a cp command, just like docker does.
~ kubectl cp --help
Copy files and directories to and from containers.

Examples:
  # !!!Important Note!!!
  # Requires that the 'tar' binary is present in your container
  # image.  If 'tar' is not present, 'kubectl cp' will fail.

  # Copy /tmp/foo_dir local directory to /tmp/bar_dir in a remote pod in the
default namespace
  kubectl cp /tmp/foo_dir <some-pod>:/tmp/bar_dir

  # Copy /tmp/foo local file to /tmp/bar in a remote pod in a specific container
  kubectl cp /tmp/foo <some-pod>:/tmp/bar -c <specific-container>

  # Copy /tmp/foo local file to /tmp/bar in a remote pod in namespace
<some-namespace>
  kubectl cp /tmp/foo <some-namespace>/<some-pod>:/tmp/bar

  # Copy /tmp/foo from a remote pod to /tmp/bar locally
  kubectl cp <some-namespace>/<some-pod>:/tmp/foo /tmp/bar

Options:
  -c, --container='': Container name. If omitted, the first container in the pod
will be chosen

Usage:
  kubectl cp <file-spec-src> <file-spec-dest> [options]
An important note is that the tar binary needs to be present in the container for this to work, but since most often this is the case, this cp command will work in most cases. Using it is really simple. For instance if we want to copy the /etc/hosts file from a container to our local machine:
~ kubectl cp another-1:/etc/hosts .

~ cat hosts
# Kubernetes-managed hosts file.
127.0.0.1	localhost
::1	localhost ip6-localhost ip6-loopback
fe00::0	ip6-localnet
fe00::0	ip6-mcastprefix
fe00::1	ip6-allnodes
fe00::2	ip6-allrouters
10.1.0.57	another-1
5. Run and attach directly for one of jobs
Sometimes you just want to run one of commands, instead of deploying and running a pod using create or apply. For this kubernetes provides you with the run command, where you can very easily fire up a container:
~ kubectl run one-off --rm --restart=Never -it --image=ubuntu -- cat /etc/lsb-release
DISTRIB_ID=Ubuntu
DISTRIB_RELEASE=18.04
DISTRIB_CODENAME=bionic
DISTRIB_DESCRIPTION="Ubuntu 18.04.1 LTS"
pod "one-off" deleted
Or if you want a shell to do some stuff, and which is cleaned up when you’re done:
~ kubectl run my-bash --rm --restart=Never -it --image=ubuntu -- bash
If you don't see a command prompt, try pressing enter.
root@my-bash:/# ls
bin   dev  home  lib64  mnt  proc  run   srv  tmp  var
boot  etc  lib   media  opt  root  sbin  sys  usr
root@my-bash:/# exit
exit
pod "my-bash" deleted
Really useful if you quickly want to check some settings from the context of a pod or namespace. This is also a great way to test around whether a service account has the correct rights, as you’ll see further down.
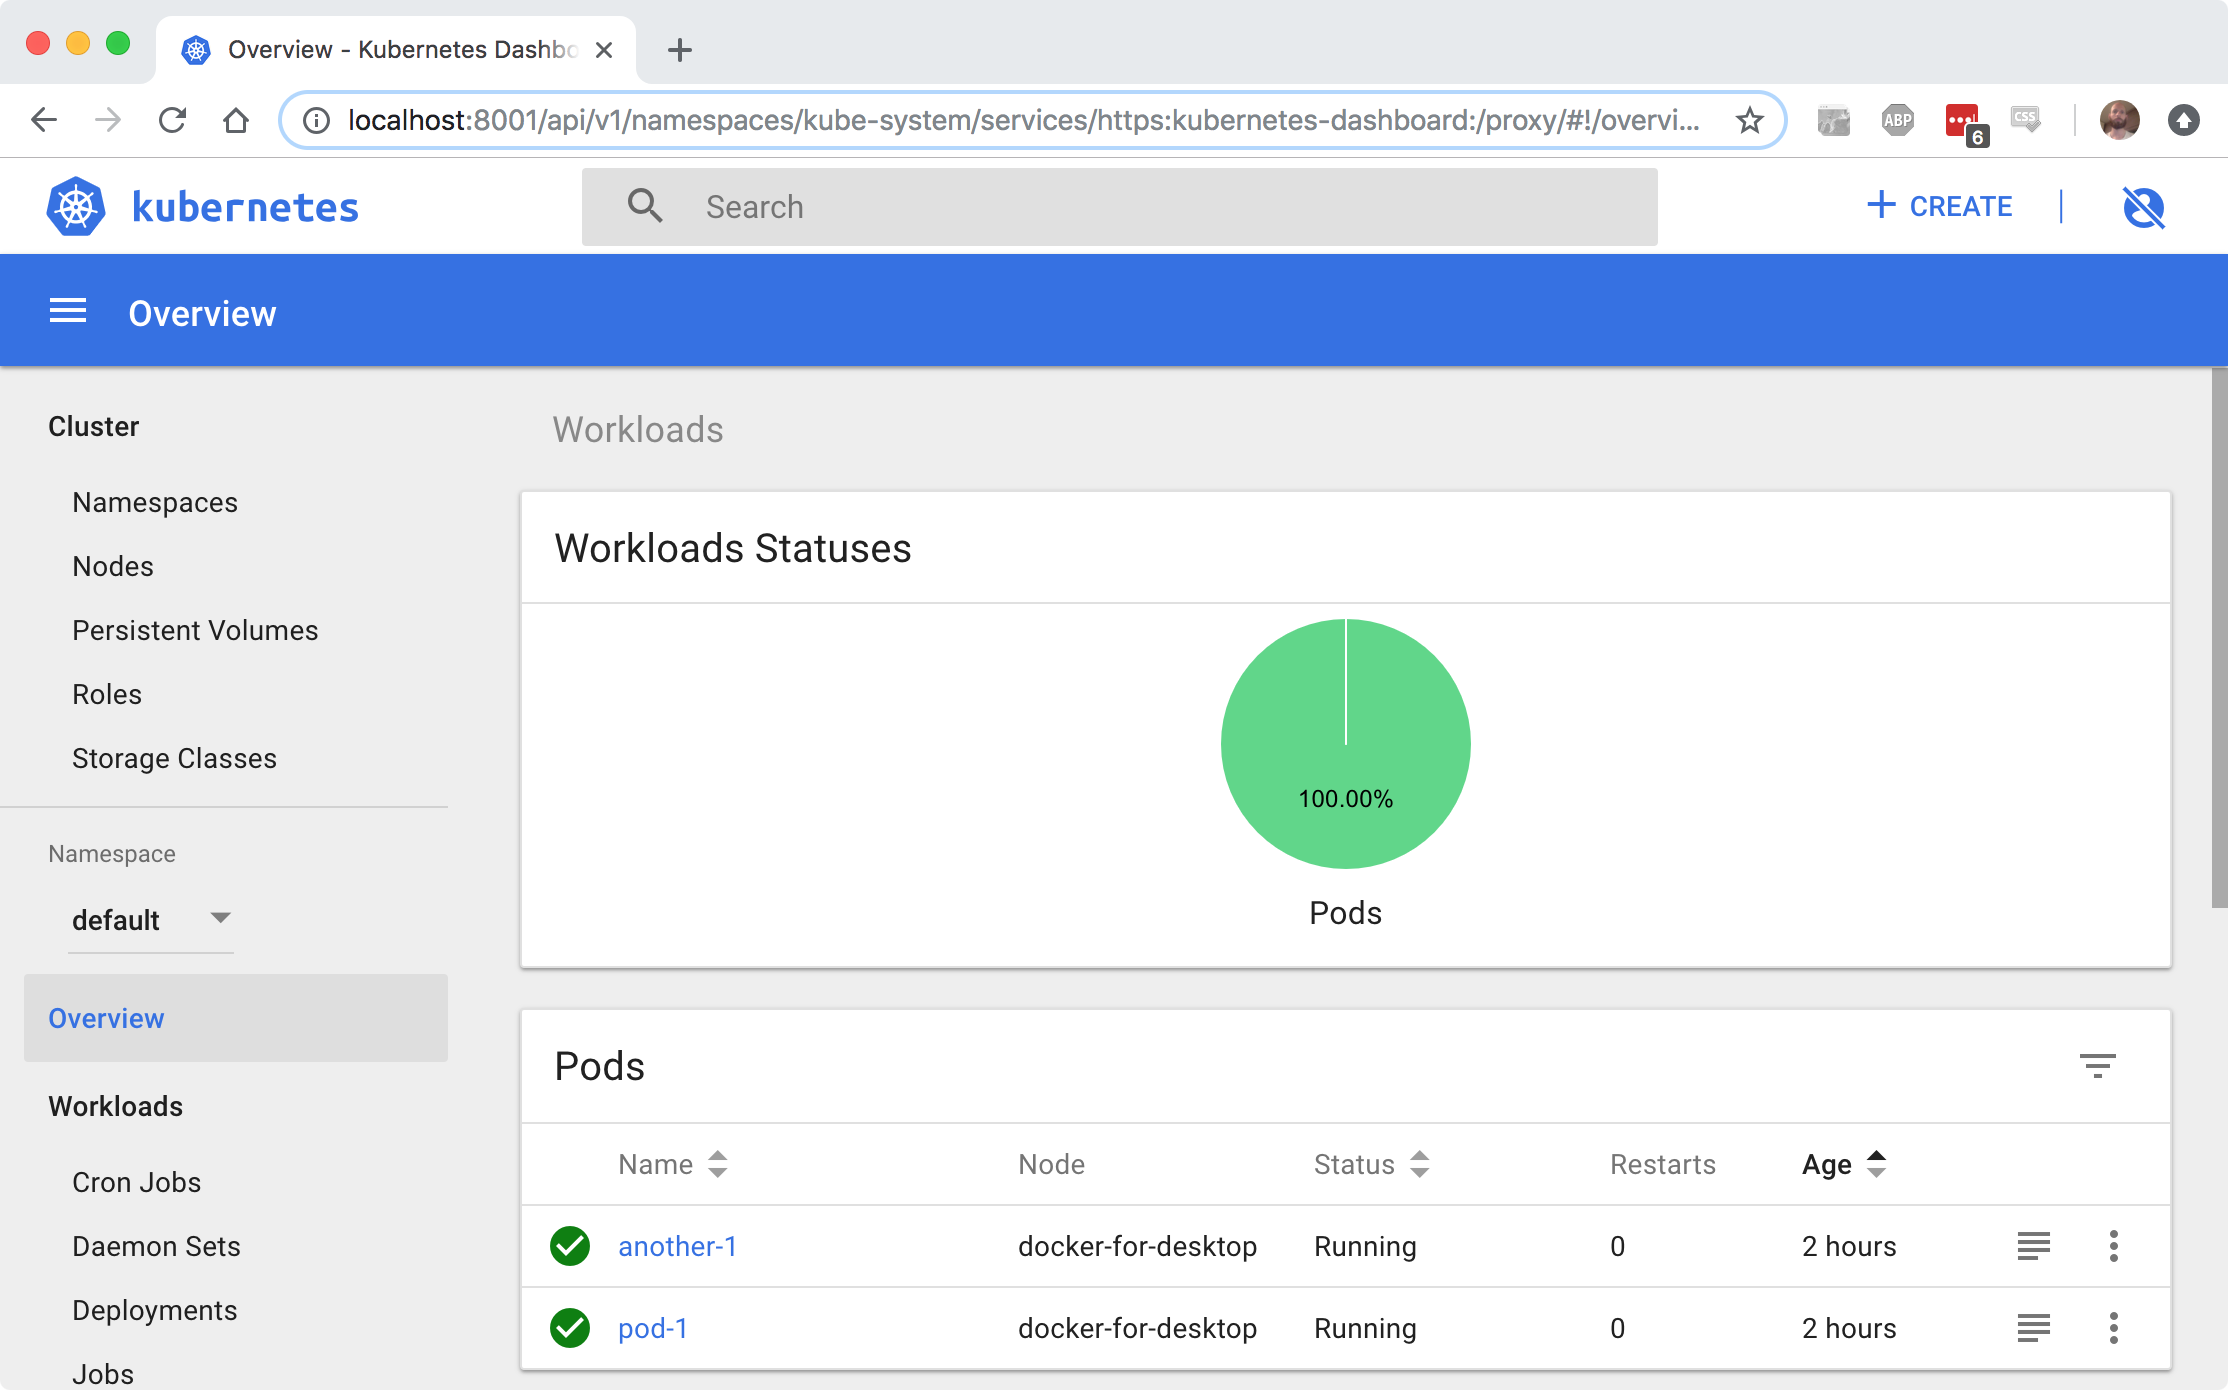
6. Kubernetes UI is great
Not much to add here. I really like the standard UI from kubernetes. Just launch a local proxy:
~ kubectl proxy
Starting to serve on 127.0.0.1:8001
And you’ve got a great UI like this:
You can make it even nice by adding
~ kubectl apply -f https://raw.githubusercontent.com/kubernetes/heapster/master/deploy/kube-config/rbac/heapster-rbac.yaml
~ kubectl create -f https://raw.githubusercontent.com/kubernetes/heapster/master/deploy/kube-config/influxdb/influxdb.yaml
~ kubectl create -f https://raw.githubusercontent.com/kubernetes/heapster/master/deploy/kube-config/influxdb/grafana.yaml
~ kubectl create -f https://raw.githubusercontent.com/kubernetes/heapster/master/deploy/kube-config/influxdb/heapster.yaml
You might need to restart the dashboard after these changes, and you should have something running like this in the kube-system namespace:
~ kubectl get pods --namespace kube-system
NAME                                         READY   STATUS    RESTARTS   AGE
etcd-docker-for-desktop                      1/1     Running   0          126d
heapster-7ff8d6bf9f-kgpt5                    1/1     Running   0          2m
kube-apiserver-docker-for-desktop            1/1     Running   0          126d
kube-controller-manager-docker-for-desktop   1/1     Running   0          126d
kube-dns-86f4d74b45-kqdhn                    3/3     Running   0          126d
kube-proxy-l559k                             1/1     Running   0          126d
kube-scheduler-docker-for-desktop            1/1     Running   0          126d
kubernetes-dashboard-7d5dcdb6d9-ph2gq        1/1     Running   1          126d
monitoring-grafana-68b57d754-8p8nc           1/1     Running   0          2m
monitoring-influxdb-cc95575b9-q2v9s          1/1     Running   0          2m
Now when you open up the UI, you don’t just see the default information, but also see a lot of details and metrics on how your system is running:

I noticed myself that I’m using this dashboard quite often. With docker I did pretty much everything using the CLI, but for quick overviews of what is happening, this dashboard (especially with the metrics), really just works.
The final part, not really related to the dashboard but interesting anyhow, is that this also sets up grafana. We can now connect directly to grafana and setup our own metrics.
~ kubectl --namespace kube-system get service monitoring-grafana
NAME                 TYPE        CLUSTER-IP      EXTERNAL-IP   PORT(S)   AGE
monitoring-grafana   ClusterIP   10.98.182.140   <none>        80/TCP    8m

~ kubectl --namespace kube-system port-forward svc/monitoring-grafana 1080:80
Forwarding from 127.0.0.1:1080 -> 3000
Now open up your browser at localhost:1080 and you can start your own dashboards. You need to take into account though that by default grafana and influxdb don’t store their data on a persistent volume, so if you want to keep metrics for longer time, and avoid having to recreate your graphs, you might need to change the deployments for these components.

7. Container not starting up? overwrite the entry point and just run it from bash
Another useful approach is to override the entrypoint when your container doesn’t start as expected. Say we’ve got a simple pod like this:
apiVersion: v1
kind: Pod
metadata:
  name: wget
spec:
  restartPolicy: Never
  containers:
  - name: wget
    image: mwendler/wget
This pod isn’t normally something you’d run as a pod, but more as a one time action using kubectl run. This pod wraps the wget command, and since we didn’t specify any arguments it’ll fail when we create it:
~ kubectl create -f simple.yml
pod/wget created

~ kubectl ls
NAME        READY   STATUS    RESTARTS   AGE
another-1   1/1     Running   0          3h
pod-1       1/1     Running   0          3h
wget        0/1     Error     0          8s
If this is an image that contains some initialization scripting, or has a more complex startup procedure, it’d be handy to be able to just start a shell, and see the environment variables, run the script from there, maybe finetune it on the container to see what works instead of rebuilding images. For this we can just specify a command in the yaml.
apiVersion: v1
kind: Pod
metadata:
  name: wget
spec:
  restartPolicy: Never
  containers:
  - name: wget
    image: mwendler/wget
    command: [sh, -c, "sleep 1000"]
And run it, and use kubectl exec to connect to it.
~ kubectl create -f simple.yml
pod/wget created
~  tmp kubectl ls
NAME        READY   STATUS    RESTARTS   AGE
another-1   1/1     Running   0          3h
pod-1       1/1     Running   0          3h
wget        1/1     Running   0          10s
~ kubectl exec -ti wget sh
/ # which wget
/usr/bin/wget
/ # uname -a
Linux wget 4.9.93-linuxkit-aufs #1 SMP Wed Jun 6 16:55:56 UTC 2018 x86_64 Linux
/ #
And this will work with most containers, and is a very easy way to see why a specific entrypoint.sh might be failing, or to test other parts of that container.
8. Running an embedded kubernetes from docker
There are lots and lots of resources out there that explain how to setup a kubernetes cluster. For quick testing I often use the embedded one from Docker. Docker provides this for a while now:
Kubernetes is available in Docker for Mac 17.12 CE Edge and higher, and 18.06 Stable and higher , this includes a standalone Kubernetes server and client, as well as Docker CLI integration. The Kubernetes server runs locally within your Docker instance, is not configurable, and is a single-node cluster.
To setup your own local kubernetes cluster all you have to do is enable kubernetes in the kubernetes tab of the docker preferences:
And you’ve got yourself a locally running kubernetes setup. You might need to install kubectl, but docker will configure your local .kube/config file so you work with the cluster directly.
9. Using apply instead of create
Moving to the end of the 10 tips, which is basically an interesting one, if you want to do more controlled rollouts. If you’ve deployed a deployment consisting out of three instances, you’d normally don’t want to update them all at the same time. You just want to apply the new settings, one at a time. The most basic way to do this, is to just use apply when you create a set of resources from a file, instead of using create. If you do a create on the same resource, kubernetes will complain that the resources probably already exist, and it won’t recreate them. When using apply however, kubernetes will check for any changes, and determine which resources to reload.
The cool thing about this is, that it’ll do this pod by pod. If we’ve got this simple description:
apiVersion: apps/v1
kind: Deployment
metadata:
  name: simple-deployment
  labels:
    app: simple
spec:
  replicas: 3
  selector:
    matchLabels:
      app: simple
  template:
    metadata:
      labels:
        app: simple
    spec:
      containers:
      - name: wget
        image: mwendler/wget
        command: [sh, -c, "sleep 1000"]
And deploy it, we’ve got three pods:
~ kubectl apply -f ./simple.yml
deployment.apps/simple-deployment unchanged

~ kubectl ls
NAME                                READY   STATUS    RESTARTS   AGE
simple-deployment-759f65d94-62sjf   1/1     Running   0          26s
simple-deployment-759f65d94-cmxtm   1/1     Running   0          26s
simple-deployment-759f65d94-cr2cw   1/1     Running   0          26s
Now when we change a single property in the deployment, and do apply again, you’ll see that it updates one by one:
~ kubectl apply -f ./simple.yml
~ kubectl ls
NAME                                 READY   STATUS              RESTARTS   AGE
simple-deployment-759f65d94-62sjf    1/1     Terminating         0          2m
simple-deployment-759f65d94-cmxtm    1/1     Running             0          2m
simple-deployment-759f65d94-cr2cw    1/1     Terminating         0          2m
simple-deployment-7f6f9d4dcf-2mhws   0/1     ContainerCreating   0          4s
simple-deployment-7f6f9d4dcf-m9kvr   1/1     Running             0          8s
simple-deployment-7f6f9d4dcf-w8jkf   1/1     Running             0          13s
10. Working with service accounts
As a final note, some info on service accounts. Kubernetes provides a great API to monitor, control the complete cluster. For certain applications and services it’s very useful to access that API. However, you don’t want to give a pod complete access to the whole API, but only to the part where it is allowed. This is where RBAC and service accounts come into play. There are enough sites that explain how to set this up, so I only want to focus on the practical part of it, on how to use this for your own.
For this we’ll use a simple ubuntu container and add some extra resources:
---
apiVersion: v1
kind: ServiceAccount
metadata:
  name: simple-view
  namespace: default

---
apiVersion: rbac.authorization.k8s.io/v1beta1
kind: ClusterRole
metadata:
  name: simple-view
rules:
- apiGroups:
  - ""
  resources:
  - endpoints
  - pods
  - namespaces
  verbs:
  - get
  - list
  - watch

---
kind: ClusterRoleBinding
apiVersion: rbac.authorization.k8s.io/v1beta1
metadata:
  name: simple-bind
roleRef:
  kind: ClusterRole
  name: simple-view
  apiGroup: rbac.authorization.k8s.io
subjects:
- kind: ServiceAccount
  name: simple-view
  namespace: default

---
apiVersion: v1
kind: Pod
metadata:
  name: wget
spec:
  serviceAccount: simple-view
  containers:
  - name: wget
    image: ubuntu
    command: [sh, -c, "sleep 1000"]
This fires up an ubuntu container. The reason is that some alpine versions seem to have an issue with DNS resolving, so we’ll just use an standard ubuntu container, and install wget on that.
~ kubectl create -f ./simple.yml
serviceaccount/simple-view created
clusterrole.rbac.authorization.k8s.io/simple-view created
clusterrolebinding.rbac.authorization.k8s.io/simple-bind created
pod/wget created
~ kubectl exec -ti wget bash
# apt-get update
...
# apt-get install wget
...
# cd /var/run/secrets/kubernetes.io/serviceaccount
# ls -l
total 0
lrwxrwxrwx    1 root     root            13 Dec 17 15:21 ca.crt -> ..data/ca.crt
lrwxrwxrwx    1 root     root            16 Dec 17 15:21 namespace -> ..data/namespace
lrwxrwxrwx    1 root     root            12 Dec 17 15:21 token -> ..data/token
Here we’ve got a token file. This file contains the bearer token which we can include in our requests to the API. If we don’t add this and try to query the API from within the container we see something like this:
# wget --no-check-certificate -S -O - https://kubernetes/api/v1/namespaces
--2018-12-17 15:41:17--  https://kubernetes/api/v1/namespaces
Resolving kubernetes (kubernetes)... 10.96.0.1
Connecting to kubernetes (kubernetes)|10.96.0.1|:443... connected.
WARNING: cannot verify kubernetes's certificate, issued by 'CN=kubernetes':
  Unable to locally verify the issuer's authority.
HTTP request sent, awaiting response...
  HTTP/1.1 403 Forbidden
  Content-Type: application/json
  X-Content-Type-Options: nosniff
  Date: Mon, 17 Dec 2018 15:41:17 GMT
  Content-Length: 289
2018-12-17 15:41:17 ERROR 403: Forbidden.
We don’t have the correct rights to access this specific endpoint. Now when we use the token:
# TOKEN=$(cat token)
# wget --header="Authorization: Bearer $TOKEN" --no-check-certificate -S -O - https://kubernetes/api/v1/namespaces | head
HTTP request sent, awaiting response...
  HTTP/1.1 200 OK
  Content-Type: application/json
  Date: Mon, 17 Dec 2018 15:42:30 GMT
  Transfer-Encoding: chunked
Length: unspecified [application/json]
Saving to: 'STDOUT'

-                              [ <=>                                  ]   2.64K  --.-KB/s    in 0s

2018-12-17 15:42:30 (22.3 MB/s) - written to stdout [2699]

{
  "kind": "NamespaceList",
  "apiVersion": "v1",
  "metadata": {
    "selfLink": "/api/v1/namespaces",
    "resourceVersion": "547678"
  },
  "items": [
    {
      "metadata": {
You can see that we’re allowed to access the endpoint and get back the results as expected. Easy, simple and secure!
Conclusions
I want to leave it at these couple of small tips, and just like to thank everyone that helped create these great set of tools!