Movie color analysis with XBMC, Boblight, Java and D3.js
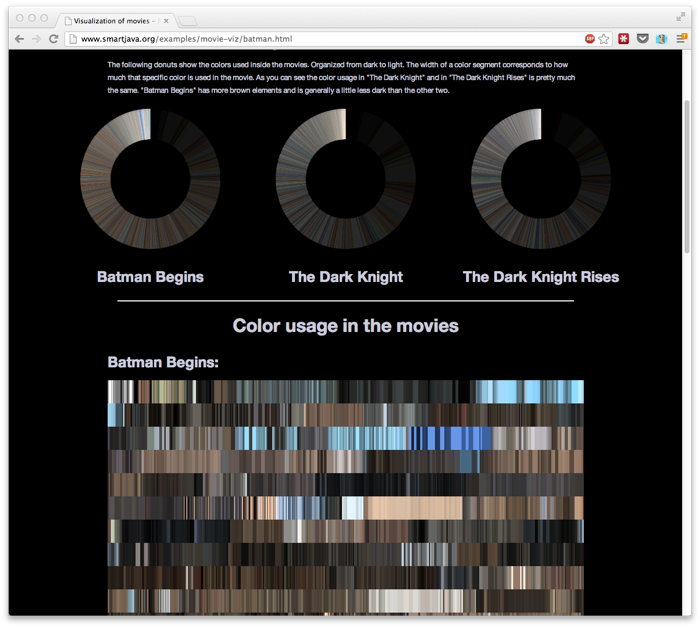
It’s been a while since I blogged, but it has been a rather busy time. Lots of big projects at work that need my complete attention, and lots of personal stuff going on. Besides that I’ve finished the first two couple of chapters for Packt on my book on Three.js, so time has been in short supply :) So, finally an update, in this update I want to show and explain a visualization experiment I’ve been working on when I get a couple of moments of time. The result of this can be found at the following two sites:
And looks like this.

I started this because a couple of months ago I saw someone visualizing movies in the form of a barcode. Every couple of seconds a frame’s ‘average’ color was determined, and put together to form a colorful barcode, that nicely shows the color usage in that specific movie. I liked the result, so I wanted to reproduce this for a couple of movies I had laying around.
I started out by looking at ways to play back movies in java/scala and analyzing the video frames myself. I quickly gave up on this approach, though. I did get java and FFMpeg working, but analyzing each frame programmatically proofed a bit more work than I initially thought. So, after some looking around, I ran into boblight. Boblight is a small library that can be used to (from the site):
Its main purpose is to create light effects from an external input, such as a video stream (desktop capture, video player, tv card), an audio stream (jack, alsa), or user input (lirc, http). Currently it only handles video input by desktop capture with xlib, video capture from v4l/v4l2 devices and user input from the commandline with boblight-constant. Boblight uses a client/server model, where clients are responsible for translating an external input to light data, and boblightd is responsible for translating the light data into commands for external light controllers.
And as an added bonus it comes with an XBMC plugin! So now I could just use my XBMC installation to play back my movies and use boblight to convert the screen to light data! Basically I needed to take the following steps to capture the light data:
- Compile, install, configure and run the boblight daemon
- Install the XBMC boblight plugin
- Play a movie
You can find information on how to compile and install boblight on their site. I had a little bit of issues with missing libraries and headers, but some quick googling and actually reading the error messages quickly fixed this. I used the following configuration:
jos@XBMC:~$ cat /etc/boblight.conf
[global]
interface       127.0.0.1

[device]
name            device1
output          dd bs=1 > /home/jos/movie.out 2>&1
channels        3
type            popen
interval        41700
debug           off

[color]
name            red
rgb             FF0000

[color]
name            green
rgb             00FF00

[color]
name            blue
rgb             0000FF

[light]
name            main
color           red     device1 1
color           green   device1 2
color           blue    device1 3
hscan           0 100
vscan           0 100
With this configuration the boblight daemon outputs the light information to a file with the name /home/jos/movie.out in the following (r,g,b) format:
0.282200 0.240661 0.206841
0.280939 0.239639 0.205967
0.279679 0.238619 0.205094
0.278934 0.238013 0.204573
0.276436 0.235238 0.201714
0.273940 0.232466 0.198857
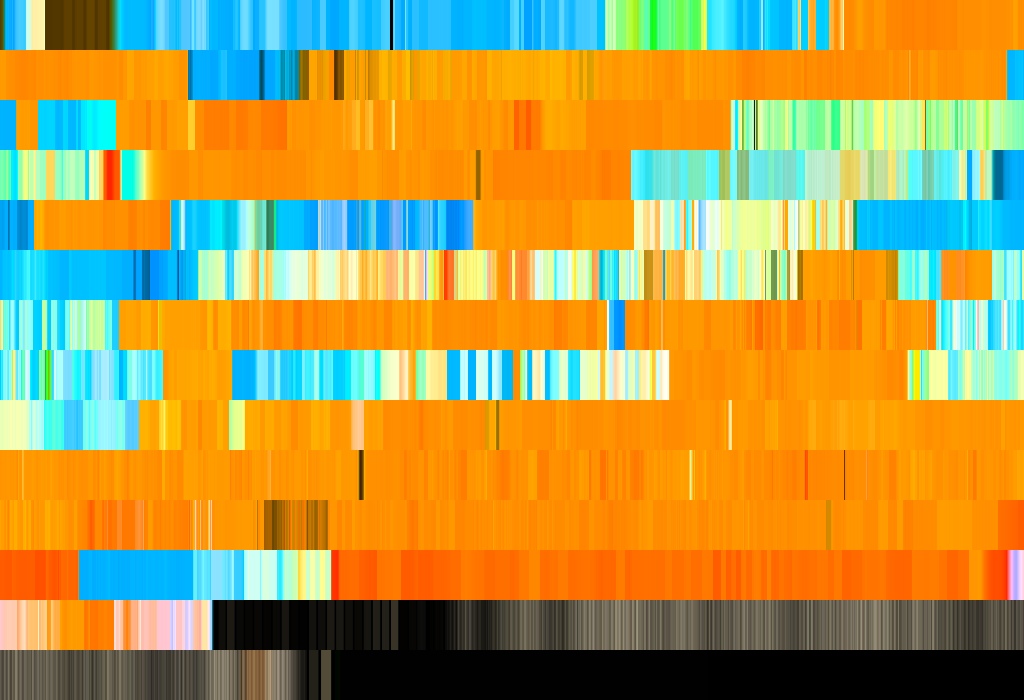
With the default settings I ran a couple of experiments (see here for the first set), but the color were a bit oversaturated and the rgb values often clipped to the maximum values. The output though looked nice (see further down for the explanation how to get this):

But I wan’t completely happy with this. It looks nice, but way to bright. So after some experimenting with the saturation and some other boblight values I got better results. For instance “The Dark Knight” looked like this:

This nicely reflects the dark mood this movie sets. The XBMC boblight configuration used for this was the following:
<settings>
    <setting id="bobdisable" value="false" />
    <setting id="hostip" value="127.0.0.1" />
    <setting id="hostport" value="19333" />
    <setting id="movie_autospeed" value="0.000000" />
    <setting id="movie_interpolation" value="true" />
    <setting id="movie_preset" value="0" />
    <setting id="movie_saturation" value="0.700000" />
    <setting id="movie_speed" value="100.000000" />
    <setting id="movie_threshold" value="20.000000" />
    <setting id="movie_value" value="2.000000" />
    <setting id="musicvideo_autospeed" value="0.000000" />
    <setting id="musicvideo_interpolation" value="false" />
    <setting id="musicvideo_preset" value="1" />
    <setting id="musicvideo_saturation" value="1.000000" />
    <setting id="musicvideo_speed" value="100.000000" />
    <setting id="musicvideo_threshold" value="0.000000" />
    <setting id="musicvideo_value" value="1.000000" />
    <setting id="networkaccess" value="false" />
    <setting id="other_misc_initialflash" value="true" />
    <setting id="other_misc_notifications" value="true" />
    <setting id="other_static_bg" value="false" />
    <setting id="other_static_blue" value="128.000000" />
    <setting id="other_static_green" value="128.000000" />
    <setting id="other_static_onscreensaver" value="false" />
    <setting id="other_static_red" value="128.000000" />
    <setting id="overwrite_cat" value="false" />
    <setting id="overwrite_cat_val" value="0" />
    <setting id="sep1" value="" />
    <setting id="sep2" value="" />
    <setting id="sep3" value="" />
</settings>
At this point I can play back a complete movie, be patient, and at the end of the movie I’ve got a complete set of colors at 24.9 FPS interval for the complete movie in the format I showed previously. With this format we can now easily create the visualizations I showed earlier. The following is my simple (very ugly) experimental java code I used for this (also tried realtime in javascript and canvas, but “The Dark Knight Rises” for instance contains over 260000 measurements and it took a while):
import java.awt.image.BufferedImage;
import java.io.File;
import java.io.IOException;
import java.util.ArrayList;
import java.util.List;

import javax.imageio.ImageIO;
import org.apache.commons.io.FileUtils;

public class BobLightConverter {

	// step through the measure points
	private final static int STEP = 12;
	// how wide is the picture
	private final static int WIDTH = 1024;
	// how much rows do we print (-1 for automatic)
	private final static int HEIGHT = -1;
	// point height and width
	private final static int P_WIDTH = 1;
	private final static int P_HEIGHT = 50;

	private final static String SRC = "dark.knight.out";

	/**
	 * @param args
	 * @throws IOException
	 */
	public static void main(String[] args) throws IOException {
		String data = FileUtils.readFileToString(new File("/Users/jos/Desktop/" + SRC));


		String[] rows = data.split("\n");
		List<String> filteredRows = new ArrayList<String>();

		System.out.println("Total number of points: " + rows.length);
		// first filter the rows based on the steps
		int stepCount = 0;
		for (String row : rows) {
			stepCount++;
			if (stepCount%STEP==0) {
				filteredRows.add(row);
			}
		}

		System.out.println("Filtered number of points: " + filteredRows.size());
		// next calculate how many elements we can store into the width
		int nWidth = (int) Math.ceil(WIDTH/P_WIDTH);
		System.out.println(nWidth);
		int nHeight = HEIGHT;
		if (nHeight == -1) {
			// calculate the height based on the image width, the P_WIDTH and P_HEIGHT
			nHeight = (int) Math.ceil(((filteredRows.size())/nWidth)+1)*P_HEIGHT;
		}


		BufferedImage image = new BufferedImage(WIDTH,nHeight, BufferedImage.TYPE_INT_RGB);

		int x = 0;
		int y = -P_HEIGHT;
		for (String row : filteredRows) {
			String[] rgb = row.split(" ");
			int r = Math.round(Float.valueOf(rgb[0])*255);
			int g = Math.round(Float.valueOf(rgb[1])*255);
			int b = Math.round(Float.valueOf(rgb[2])*255);

			// the size of each line
			if (x%WIDTH==0) {
				x=0;
				y+=P_HEIGHT;
			}

			for (int i = 0 ; i < P_WIDTH ; i++) {
				for (int j = 0 ; j < P_HEIGHT ; j++) {
					image.setRGB(x+i, y+j, 65536 * r + 256 * g + b);
				}
			}
			x+=P_WIDTH;
		}

		File f = new File("/Users/jos/" + SRC + ".png");
		ImageIO.write(image, "PNG", f);
	}
}
Not the most complex code, but with this code I can simple state the dimensions I want to have and produce, at least in my eyes, great looking visualizations. That’s pretty much all I wanted to write. As a final note, in the Batman Trilogy example I show three donuts created using D3.js. To create these I first used a simple java program to create a histogram of all the colors used. These colors are first grouped together based on rgb values (to restrict number of values) and next sorted based on their HSV value to sort from dark to light. The output from that looks like this:
r,g,b,count
0,0,0,225
7,0,0,8
0,7,7,1
7,7,7,148
7,7,0,15
14,14,14,353
For each color the count represents how often this specific color is used in the image. This is used in D3.js to create a donut.
    var pie = d3.layout.pie()
            .sort(null)
            .value(function(d) { return d.count; });

    var svg = d3.select("#donut-3").append("svg")
            .attr("width", width)
            .attr("height", height)
            .append("g")
            .attr("transform", "translate(" + width / 2 + "," + height / 2 + ")");

    d3.csv("data/histogram-darkknight.csv", function(error, data) {

        data.forEach(function(d) {
            d.count = parseInt(d.count);
        });

        var g = svg.selectAll(".arc")
                .data(pie(data))
                .enter().append("g")
                .attr("class", "arc");


        g.append("path")
                .attr("d", arc)
                //.style("fill", function(d) { return color(d.data.r); });
                .style("stroke-width","0.1")
                .style("stroke", function(d) {
                    var color =
                            (d3.rgb(parseInt(d.data.r)
                                    ,parseInt(d.data.g)
                                    ,parseInt(d.data.b)).toString())

                    return color;
                })
                .style("fill", function(d) {
                    var color =
                    (d3.rgb(parseInt(d.data.r)
                            ,parseInt(d.data.g)
                            ,parseInt(d.data.b)).toString())

                    return color;
                });

    });
Won’t dive into the details of the code here. If you’re interested though, let me know.
That’s it for this article. The examples can be found here:
And if you want to raw data, let me know and I’ll put it online somewhere.