HTML5: Render urban population growth on a 3D world globe with Three.js and canvas
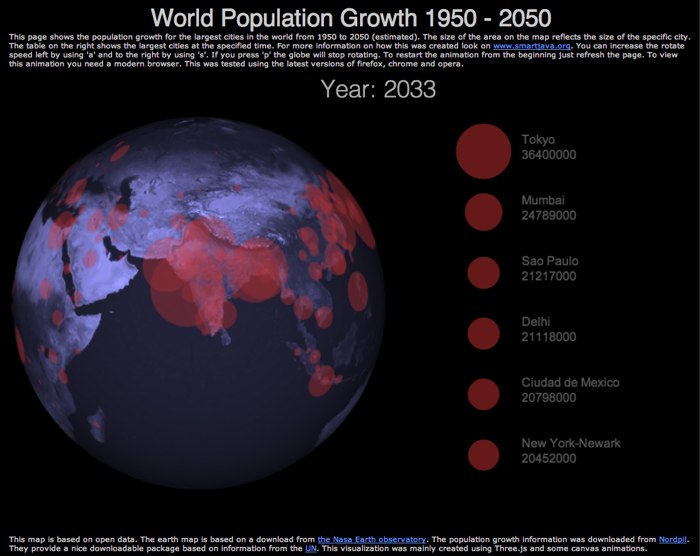
In this article I’ll once again look at data / geo visualization with Three.js. This time I’ll show you how you can plot the urban population growth over the years 1950 to 2050 on a 3D globe using Three.js. The resulting visualization animates the growth of the world’s largest cities on a rotating 3D world. The result we’re aiming for looks like this (for a working example look here.):
If you’re interested in an alternative way of rendering information look at my previous article where I used a somewhat different approach to render information on a 3D globe.
For this visualization I wanted to have the following features:
- Draw circle on the surface of a sphere to visualize the size of a city
- Show an overview of the five largest cities
- Step through the years from 1950 to 2050 and update the animation
- Control the rotation of the world by using some simple keyboard controls
All this isn’t too difficult to do with Three.js and some simple canvas manipulation. In this article I won’t dive into the details of setting up Three.js and creating the scene. If you want more information on that look at my previous article .
Draw circle on the surface of a sphere to visualize the size of a city
The first thing we need to be able to do is draw a circle for the size of each city. Before we do this let’s have a quick look at our input data. After some small fixes the data looks like this in simple csv format:
"Sofia";"";"Bulgaria";42.70;23.33;"BGR";520.00;620.00;710.00;810.00;890.00;980.00;10
70.00;1180.00;1190.00;1170.00;1130.00;1170.00;1180.00;1210.00;1230.00;1240.00;1236

"Mandalay";"";"Myanmar";21.97;96.08;"MMR";170.00;200.00;250.00;310.00;370.00;440.00;
500.00;560.00;640.00;720.00;810.00;920.00;960.00;1030.00;1170.00;1310.00;1446
Where the first record is the name of the city, the third and fourth are the location and from the seventh record we see the population size in a specific year. Starting from 1950 and increasing in steps of 5 years to 2025 with a final entry for 2050. So to draw circles we just need to read in the CSV file and for each line determine the point on the sphere and based on the year we want to draw, we create a circle with a certain radius.
Drawing a circle on a sphere sounds easy, but it’s rather difficult if you want to do it completely using Three.js. You need to create custom geometries that exactly match the curveture of the sphere and place them at the correct position. Luckily though, there is an easy alternative. With Three.js we can specify the content of a canvas as the texture for an object. We use this in the following manner:
- Create a canvas with the same aspect ratio as the map we use for our globe.
- Draw our circles directly on the canvas
- Use the canvas as a texture for a transparent sphere, just a bit bigger then the globe
- Tell Three.js when the texture needs to be updated.
I’ve defined a simple hidden canvas directly in the html for this.
<canvas id="canvas" width="1024" height="512" style="display: none;"></canvas>
And I use the following code to directly draw the circles to the canvas.
    function addCities(data, year) {

        var yearIndex = getYearIndex(year);

        var ctx = $('#canvas')[0].getContext("2d");
        ctx.clearRect(0,0,1024,512);


        var renderedValues = [];
        for (var i = 0 ; i < data.length-1 ; i++) {

            //get the data, and set the offset, we need to do this since the x,y coordinates
            //from the data aren't in the correct format
            var x = parseInt(data[i][3]);
            var y = parseInt(data[i][4]);

            var x2 =   ((1024/360.0) * (180 + y));
            var y2 =   ((512/180.0) * (90 - x));

            //draw a circle

            var yearValue = parseInt(data[i][yearIndex]);
            var nextValue = parseInt(data[i][yearIndex+1]);

            var yearSize = 5;
	    // we need to handle the period from 2025 to 2050 different
            if (yearIndex == 21) {
                yearSize = 25;
            }
            var step = (nextValue-yearValue)/yearSize;
            var valueToSet = yearValue + ((year%yearSize)*step);


            // for each city draw it at the correct position and size
            ctx.fillStyle = "#cc3333";
            ctx.globalAlpha = 0.5;
            ctx.beginPath();
            ctx.arc(x2,y2,valueToSet/1000.0,0,2*Math.PI,false);
            ctx.fill();

        }
    }
This function takes in a multidimensional array representing the CSV file (see the source or this article on how to read in CSV files). The year is the current year for which we need to render the data. Next we get the position and convert it to an x,y coordinate on our canvas. Now we need where to draw, now we need to know what to draw. For this I take the values of the two closest years. So for 1978, I use the values of 1975 and 1980 to determine the approximate city size in the specific year. Based on these calues I draw a simple semi transparent arc. This result in the following canvas (which normally you won’t see because it’s hidden).

Even though this already looks nice, especially when animated, we want to take it one step further and plot it on a sphere. For this we can use the following piece of javascript code:
    var texture;
    function addOverlay() {
        var spGeo = new THREE.SphereGeometry(604,50,50);
        texture = new THREE.Texture($('#canvas')[0]);

        var material = new THREE.MeshBasicMaterial({
            map : texture,
            transparent : true,
            opacity: 0.7,
            blending: THREE.AdditiveAlphaBlending

        });

        var meshOverlay = new THREE.Mesh(spGeo,material);
        scene.add(meshOverlay);
    }
This creates a slightly larger sphere and defines a texture based on the canvas we’ve drawn our circles to. By using a transparent material and using this specific blending mode we create a new sphere that shows all our circles on the correct positions. To make sure Three.js updates the texture we need to add “texture.needsUpdate” to our render loop.
      // render the scene
    var timer = 0;
    var rotateSpeed = 0.004;
    function render() {
        texture.needsUpdate = true;
        timer+=rotateSpeed;
        camera.position.x = (Math.cos( timer ) *  1800);
        camera.position.z = (Math.sin( timer ) *  1800);
        camera.lookAt( scene.position );

        light.position = camera.position;
        light.lookAt(scene.position);

        renderer.render( scene, camera );
        requestAnimationFrame( render );
    }
This was the most important part. We can now draw and update circles directly on a sphere.
Show an overview of the five largest cities
To show the number of largest cities we alter the addCities function we just saw:
function addCities(data, year) {

        var yearIndex = getYearIndex(year);

	...

        var renderedValues = [];
        for (var i = 0 ; i < data.length-1 ; i++) {

	     ...
            // push interesting values into array to be sorted
            renderedValues.push({value: valueToSet, city: data[i][0]});
        }

        // sort according to size
        renderedValues.sort(function(a,b){return b.value-a.value});

        // draw the overview of largest cities
        var ctx2 = $('#largest')[0].getContext("2d");
        ctx2.globalAlpha = 0.5;
        ctx2.clearRect(0,0,400,600);
        for (var j = 0; j < 6 ; j++) {
            var x = 70;
            var y = (j*80)+100;

            // draw circles
            ctx2.beginPath();
            ctx2.fillStyle = "#cc3333";
            ctx2.arc(x,y,renderedValues[j].value/1000.0,0,2*Math.PI,false);
            ctx2.fill();

            // output text
            ctx2.fillStyle = "#aaaaaa";
            ctx2.font = "16px Arial";
            ctx2.fillText(renderedValues[j].city,x+50,y-10);
            ctx2.fillText(Math.round(renderedValues[j].value)+'000',x+50,y+10);


        }
    }
Not too difficult. Each city that is drawn as a circle is pushed into an array. This array is sorted based on size, and the top 6 cities are drawn to a canvas. This canvas is shown to the right of the 3D globe.
With both the visualization components done, the next thing to do is kick of the animation. For this we use JQuery.
Step through the years from 1950 to 2050 and update the animation
    function stepYears(elements) {
        var input = {
          year: 1950
        };

        var currentYear = 0;
        $(input).animate(
                {year: 2050},
                {step: function(now)
                    {
                        var newYear = Math.round(input.year);
                        if (newYear != currentYear) {
                            $("#currentYear").text("Year: " + newYear);

                            currentYear = newYear;
                        }
                        addCities(elements, input.year);
                    },
                 duration: 45000,
                 easing: 'linear'
                }
        );
    }
This piece of JQuery updates the input variable from 1950 to 2050 over a period of 45 seconds. Since we want a linear transition we explicitly define the easing. For every change we call the addCities function we saw earlier to update the canvas we use as a texture.
The final function I wanted to add was a simple control for the rotation of the sphere.
Control the rotation of the world by using some simple keyboard controls
In this example I don’t rotate the sphere, but rotate the cameras. As we’ve seen earlier our render loop looks like this:
      // render the scene
    var timer = 0;
    var rotateSpeed = 0.004;
    function render() {
        texture.needsUpdate = true;
        timer+=rotateSpeed;
        camera.position.x = (Math.cos( timer ) *  1800);
        camera.position.z = (Math.sin( timer ) *  1800);
        camera.lookAt( scene.position );

        light.position = camera.position;
        light.lookAt(scene.position);

        renderer.render( scene, camera );
        requestAnimationFrame( render );
    }
The speed and direction of the rotation is managed by the rotateSpeed variable. If we register a keypress to update this value we can easily control the rotation.To register the keypresses I use JQuery.
            // read all the elements
            $(document).keypress(function(e) {


                switch (e.which) {
                    case 97 : {
                        // rotate globe step to left
                        rotateSpeed+=0.001;
                        break;
                    };

                    case 115 : {
                        // rotate globe step to right
                        rotateSpeed-=0.001;
                        break;
                    };

                    case 112 : {
                        rotateSpeed=0;
                        break;
                    };


                }
            });
And thats it. A working example of this demo can be found here.