Election site part 1: Basics with Knockout.js, Bootstrap and d3.js
This article shows how you can use knockout.js, Twitter’s Bootstrap and d3.js together to create a javascript application that creates visually pleasing graphics and diagrams to your users. This is complete client side solution that only communicates with REST to the server. This is part 1 of a series of articles discussing these concepts. In this first article we’ll look at setting up the basic application and we’ll demonstrate how to use knockout.js, bootstrap and d3.js. It’s a bit too much to show all the javascript in this article. You can find the demo for this version (with a couple more features) at this url: http://www.smartjava.org/examples/election/part1.html. So if you want to see the some of the util functions I use look at the javascript used in that example.
The case
In the Netherlands, where I live, we have a tendency of our chosen leaders not serving their terms. More often then not, through a breach of trust, or some other big (or sometimes minor) issue the cabinet collapses and we have new elections. During election time we’re spammed with all kinds of predictions, charts and people telling us how the Dutch people are going to vote. And when we finally vote we can see real-time updates throughout the evening, and on many websites showing us the cast votes for each municipality. </p>
Creating an election map
These updates, and the way they are presented is kind of interesting. Usually a map is shown with all the municipalities where colors depict how they voted, the presenter then zooms in on a specific municipality and shows some more detailled results. And this isn't something they do just in the Netherlands:
US elections
Which tools will we use?
Now hard would it be to build an application that allows you to view the results per district, using just standard web technologies. No Flash, no plugins, just basic HTML and javascript. In this first article of a sample election site, we'll focus on getting the basic components together and working. To be more specific we'll create a site where we use the following tools:
- Knockout.js as our javascript application framework.
- Twitter's Bootstrap as basis for the application and layout.
- D3.js to make working with SVG and maps easier.
Besides these tools we’ll be connecting to a Play 2.0 Rest service that provides us with the information that we’ll show. All in all we’ll be creating a simple application that looks like this:
Show complete map, with colors representing a specific value
Show the details of a specific municipality
Prerequisites: JSON Data
In this example we’ll use a set of geo json elements as the data for our application. In a previous article I already showed the basics of how to convert data to this format. For more information on how to create a REST service to expose this information see my other articles on this subject. For this example we’ll use a set of GeoJSON records. These records contain information about the geography of a specific city and it contains some statistics on the residents (such as age distribution, percentage foreigners, widowers etc.). For instance the record for Amsterdam looks like this:
{ "geometry" : { "coordinates" : [ [ [ [ 4.750558564252043,
                52.429385009319844
              ],
              [ 4.983615108367763,
                52.36497825292634
              ],
             ...
              [ 4.9846764177139704,
                52.36565814884794
              ]
            ] ]
        ],
      "type" : "MultiPolygon"
    },
  "gm_code" : "GM0363",
  "gm_naam" : "Amsterdam",
  "properties" : { "aant_inw" : "779810",
      "aant_man" : "383800",
      "aant_vrouw" : "396005",
      "aantal_hh" : "431060",
      "bev_dichth" : "4704",
      "gem_hh_gr" : "1.8",
      "gm_code" : "GM0363",
      "gm_naam" : "Amsterdam",
      "opp_land" : "16576",
      "opp_tot" : "21932",
      "opp_water" : "5356",
      "p_00_14_jr" : "16",
      "p_15_24_jr" : "13",
      "p_25_44_jr" : "35",
      "p_45_64_jr" : "25",
      "p_65_eo_jr" : "11",
      "p_ant_aru" : "2",
      "p_eenp_hh" : "56",
      "p_gehuwd" : "26",
      "p_gescheid" : "9",
      "p_hh_m_k" : "24",
      "p_hh_z_k" : "19",
      "p_marokko" : "9",
      "p_n_w_al" : "35",
      "p_ongehuwd" : "61",
      "p_over_nw" : "10",
      "p_surinam" : "9",
      "p_turkije" : "5",
      "p_verweduw" : "4",
      "p_west_al" : "15"
    },
  "type" : "Feature"
}
Knockout.js: Setup the model
The first thing we’ll look at is the model we’ll use in Knockout.js. With Knockout.js you can bind any javascript object to a specific HTML/DOM element. So let’s look at the model we’ll use for this.
var country = function(cities, feature) {
    this.cities = cities;
    this.geojson = feature;
}

// city object containing the name, code and properties
// of a specific city. Also contains the geojson for
// this specific city.
var city = function(name, code, properties, feature)  {
    this.name = name;
    this.code = code;
    this.properties = properties;
    this.geojson = feature;

    this.getPropertyValue = function(propertyName) {
        for (var i = 0 ; i < properties.length ; i++) {
            if (properties[i].key == propertyName) return properties[i].value;
        }
    }
};
Very simple javascript objects. Can be optimized for performance, but that’s not something for now. The final model object we need is the viemodel. This model is the central access point for knockout.js bindings and access from other javascript libraries and scripts.
var viewModelContainer = function() {
    self = this;

    // contains all the cities
    this.country = ko.observable();

    // the metrics that are available
    this.metrics = ko.observableArray([]);

    // the selected metric
    this.selectedMetric = ko.observable();

    // the selected city when we start is an empty variable
    this.selectedCity = ko.observable();

    // computed to change when either the metric
    // or the map changes
    this.metricChange = ko.computed(function() {
        this.selectedMetric();
        this.country();
    }, this);

    // function to retrieve a single city
    this.getCity = function(cityCode) {
        for(var i = 0 ; i < this.country().cities().length ; i++ ) {
            var city = this.country().cities()[i];
            if (city.code == cityCode) return city;
        }
    }
}
Here we see the first signs of knockout.js. We define a number of ko.observable() objects. What this means is that knockout.js will inform the html/dom objects that are bound to such a ko.observable() whenever the value of the observable changes. When we look at the html part of this tutorial we’ll see how to use them. First though, we need data to fill the model. For this we use JQuery’s REST support:
Load JSON data using a REST call
We load the geo data and the various metrics using the following piece of code.
function loadDataCBS() {
    // get all the fields
    $.getJSON(appConstants.JSON_URL_CBS, function(citiesList) {
        // get the cities to proces
        var allCities = citiesList.features;

        // temp value, before we push it to the observable array
        var cities = [];

        // keep track whether we analyzed the supplied metrics
        var propertiesAnalyzed = false;
        var metrics = [];

        // walk through the array and each city to the observable array
        for (i = 0 ; i < allCities.length ; i++) {

            // keys are a set of keypairs that are added to the object
            var keys = [];
            analyzeProperties(allCities[i].properties, keys, metrics, propertiesAnalyzed);

            // add all the found cities to the viewmodel at once. Add lazy loading in a
            // later stage
            cities.push(new city(
                allCities[i].gm_naam,
                allCities[i].gm_code,
                keys,
                allCities[i]
            ));

            // after the first iteration, metrics have been analyzed
            propertiesAnalyzed = true;
        }

        // create a country and setthe properties
        var country = new Country(cities,citiesList.features);

        // set the values in the viewmodel.
        viewModel.country(country);
        viewModel.metrics(metrics);
    })
}

function analyzeProperties(properties, keys, metrics, propertiesAnalyzed) {
    for(var propertyName in properties) {
        var prop = new property(propertyName,properties[propertyName]);
        keys.push(prop);

        if (!propertiesAnalyzed) {
            // simple analyze of the properties. If starts with p_ assume it is a percentage
            // which we can plot on the country overview
            if (prop.key.substring(0,2) == "p_") {
                metrics.push(prop.key);
            } else {
                // if doesn't start with a p_ we can check whether the value is
                // a number
                if (!isNaN(prop.value)==true) {
                    // we have number, so add this metric
                    metrics.push(prop.key);
                }
            }
        }
    }
}
The comments inline should explain what happens. Basically what we do is we make a call using $.getJSON(appConstants.JSON_URL_CBS, function(citiesList) { and then we analyze the result and fill the viewModel, so that we have information to show in the browser.
Connect all the things
We need to connect everything together so knockout.js knows what to bind. For this we created a simple ‘application’ that creates our model, loads the json data and initializes knockout.js
function init() {
    // load json data
    loadDataCBS();

    // setup the projections, used to render geojson
    geo.setupGeo();

    // finally bind everything to the model
    ko.applyBindings(viewModel);
}

// create the viewmodel, this model can be referenced
// from all the different files
var viewModel = new viewModelContainer();

// and start the application
init();
In our html we include this javascript at the end, so once our html is loaded, the application is initialized.
Bind HTML elements to the model
In this first part we’re not going to create too complex bindings. Basically we need to bind the following elements:
- Dropdown boxes with selection
- Table showing the properties of the selected city
- SVG Map to show the details of the selected metric
- SVG Map to show the contours of the selected city
Bind dropdown boxes
We want to bind the information from the model (all the available cities and all the available metrics) to two drop down selections.
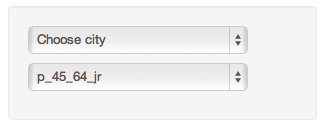 We do this directly through a knockout.js binding:
                <div data-bind="with: country">
                    <select data-bind="options: cities,
                       optionsText: 'name',
                       value: $parent.selectedCity,
                       optionsCaption: 'Choose city'"></select>
                </div>

                <!--
                    Bind to list of available metrics. Only do this, when
                    no city has been selected.
                -->
                <div data-bind="ifnot: selectedCity">
                    <select data-bind="options: metrics,
                       value: selectedMetric,
                       optionsCaption: 'Choose metric'"></select>
                </div>
In this example you can see a couple of interesting knockout.js features. Lets start by looking at the second binding. Here we use a data-bind=”ifnot: selectedCity” to determine whether to render this specific div. If no city is selected this div is rendered and the select element binding is processed. In this binding we bind the “options” of the select element to the metrics property of our viemodel, and once a value is selected it is stored in the “selectedMetric” property of the viewmodel. For the first dropdown we do something similar, but we’ve also wrapped the div inside another div with the data-bind=”with: country” binding. This means that all the bindings inside this div are processed in the context of the “country” element. The binding of the dropdown points to “cities”, since we are in the context of the country element, all elements from the country.cities array are shown in this dropdown. The label we show points to a property of the city object: name, and when a city is selected it is stored in “$parent.selectedCity”. $parent is a property you can use to access the parent context. In this case, since we use the “with” binding, we can access the root context of the viewmodel to set the “selectedCity” property.
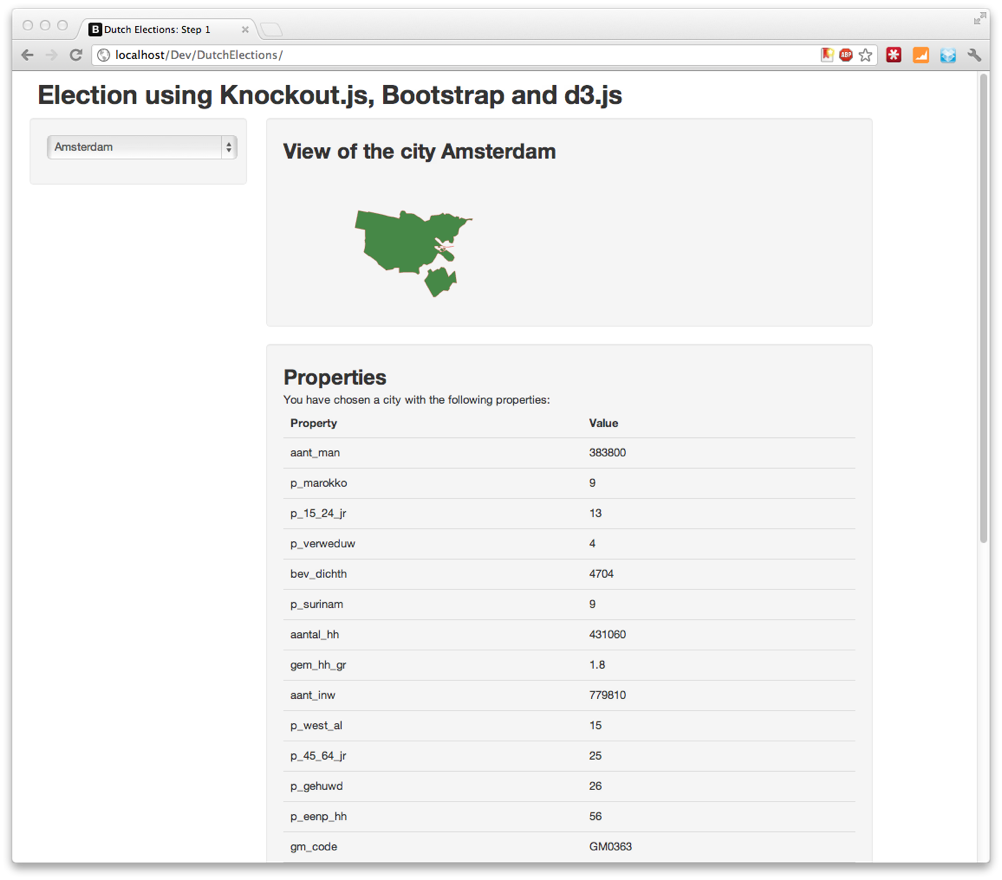
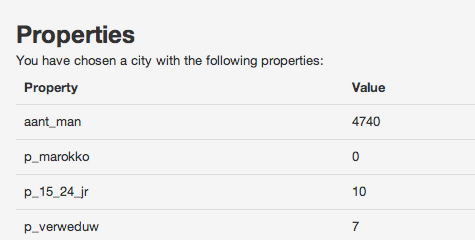
Show a table when a city is selected
When a user selects a city from the dropdown menu, we want to show a table with all the properties of this city. To accomplish this we use the following piece of HTML
                <div data-bind="if: selectedCity" class="span9">
                    <div class="well">
                        <h2>Properties</h2>
                        You have chosen a city with the following properties:
                        <table class="table">
                            <thead>
                            <tr>
                                <th>Property</th>
                                <th>Value</th>
                            </tr>
                            </thead>
                            <!-- iterate over each property, and add a row -->
                            <tbody data-bind="foreach: selectedCity().properties">
                            <tr>
                                <td data-bind="text: $data.key"></td>
                                <td data-bind="text: $data.value"></td>
                            </tr>
                            </tbody>
                        </table>
                    </div>
                </div>
We once again use a binding to see if we should render this div, in the same way we’ve shown earlier. If a city is selected we start rendering a table, and bind the “tbody” element to the list of properties with a “foreach” binding. As the name implies, this binding iterates over the properties to render the “tr” elements. We then just need to do a simple text binding to “$data.key” to render the content of the cells. Here $data is a special keyword which allows you to access the current property from the list that is being processed.
SVG Map to show the contours of the selected city
So far we’ve seen how to connect the dropdown boxes and the table to the knockout view model. If the city we selected changes, our viewmodel is updated, which also triggers an update of the table. The next component we want to show when a city is selected are the contours of the city. When we retrieved the main JSON object we also received the geo coordinates (in WGS84 format) for each city, which we stored in our model:
var city = function(name, code, properties, feature)  {
    this.name = name;
    this.code = code;
    this.properties = properties;
    this.geojson = feature;  // the contours of the city

    this.getPropertyValue = function(propertyName) {
        for (var i = 0 ; i < properties.length ; i++) {
            if (properties[i].key == propertyName) return properties[i].value;
        }
    }
};
To render this as a map we use the excellend d3.js library, I won’t dive into too much detail (see this article for more info) on d3.js, I’ll just show how you can create a custom binding that returns a rendered map. The goal we’re aiming for is this:
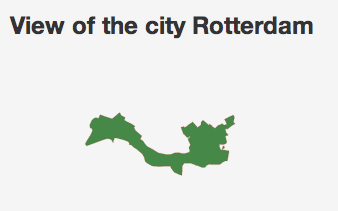
For this we create a custom binding that we’ll use like this:
                <div data-bind="if: selectedCity" class="span9">
                    <div class="well">
                        <h2>View of the city <span
                                data-bind="text: selectedCity() ? selectedCity().name : 'unknown'"></span></h2>
                        <!--
                            in this binding, we bind directly to the group element,
                            whenever the selectedCity changes, we update this element using
                            a custom binding.
                        -->
                        <svg id="localMapContainer" xmlns="http://www.w3.org/2000/svg">
                            <g id="localMap"
                               data-bind="d3svgSingle: selectedCity"/>
                        </svg>
                    </div>
As you can see we first use a normal knockout.js binding to bind the name to our header. And next we bind an svg group element to the custom d3svgSingle binding. This means that this binding will be invoked each time our selectedCity in the model changes. This custom binding can be added using this piece of javascript:
ko.bindingHandlers.d3svgSingle = {
    init:function (element, valueAccessor, allBindingsAccessor, viewModel) {
        // we don't do anything on initialize
    },
    update:function (element, valueAccessor, allBindingsAccessor, viewModel) {
        // make sure the model is correctly initialized. If not don't render
        // anything
        if (typeof viewModel.selectedCity() != "undefined" && element.id != null) {
            // first remove all the elements currently set on the object
            // for this we use the d3 helper function. Remember for the single
            // city we render directly to the group.
            d3.select(element).selectAll("path").remove();

            // now convert the geojson string to a path object
            // and add it to the supplied binding
            var svgPath = geo.path(viewModel.selectedCity().geojson);
            d3.select(element)
                .append("path")
                .attr("d", svgPath);

            // resize to fill the complete div
            geons.resizeSVG(element, appConstants.CITY_VIEW_X, appConstants.CITY_VIEW_Y);
        }
    }
}
The inline comments should explain nicely what we do here. We use d3.js geo.path function (initialization of geo object isn’t shown here) to convert our geojson information to an SVG path. We then use d3.js to append a “path” element to the group we bound the property to, and on that new path element we set the d attribute with the value of the svg path. The last step we do here is resizing the svg so it nicely fits the space we allocated for it (code not shown).
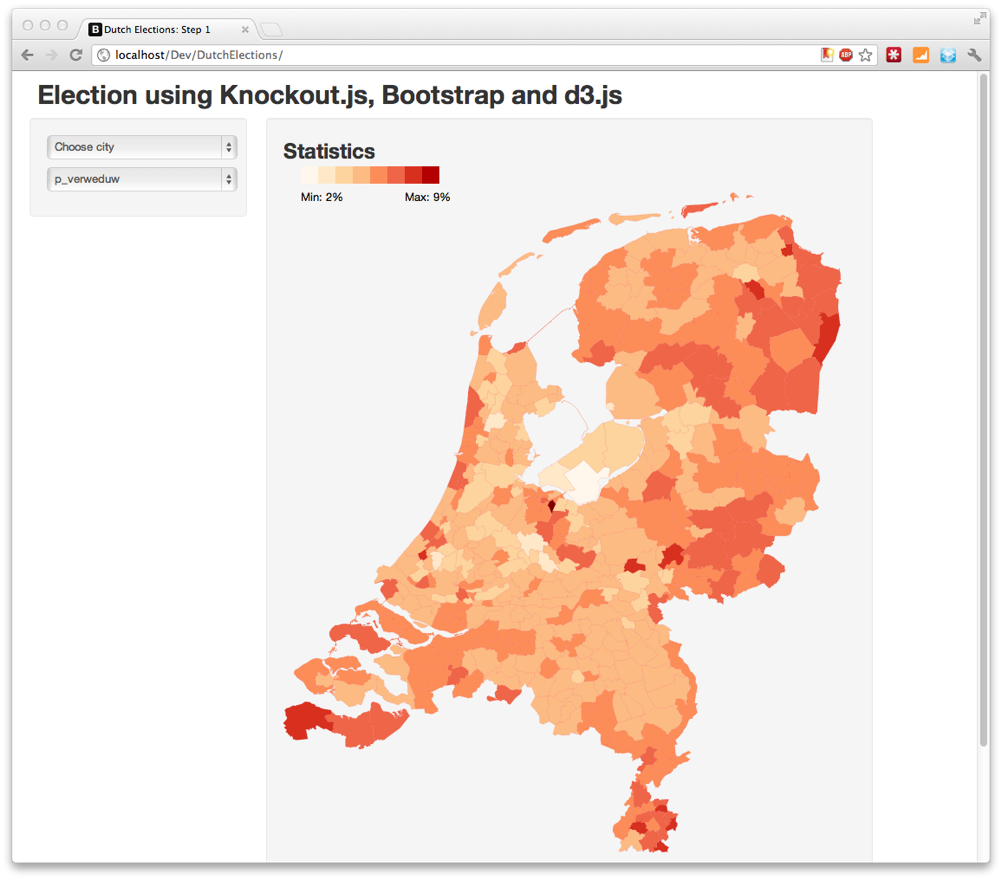
SVG Map to show the details of the selected metric
The final step we need to do, is show a map that represents the values of a selected metric:
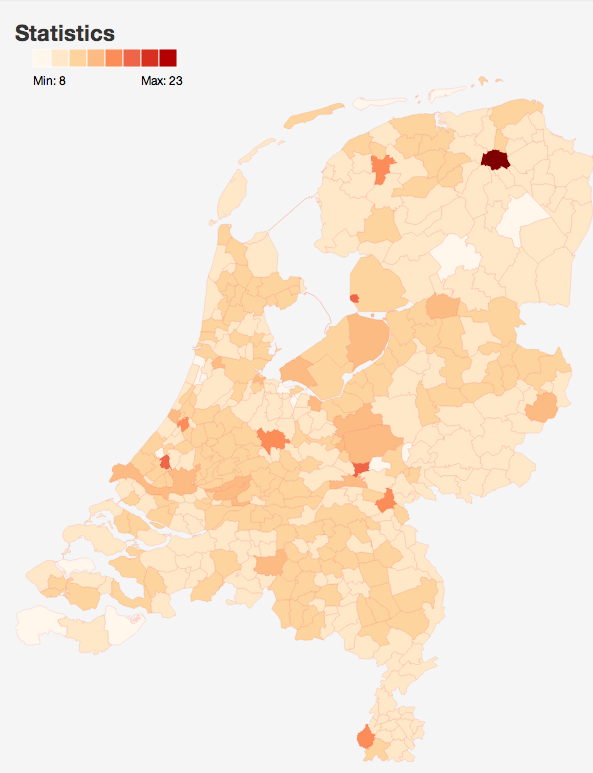
This is also called a cchoropleth map. For this we once again create a custom binding, that we bind like this:
                <!--If no city is selected, view the complete map-->
                <div data-bind="ifnot: selectedCity" class="span9">
                    <div class="well">


                            <h2>Statistics</h2>

                        <!-- here we bind the svg element itself to a binding. If the
                             country value changes, this element is updated -->
                        <svg id="countryMapContainer" xmlns="http://www.w3.org/2000/svg"
                             data-bind="d3svg: metricChange()">
                        </svg>
                    </div>
                </div>
            </div>
This div is shown when no city is selected. The content of the svg is updated whenever one of the metrics changes. Before we look at the code of the binding, lets look at how this is configured in our viewmodel.
    // computed to change when either the metric
    // or the map changes
    this.metricChange = ko.computed(function() {
        this.selectedMetric();
        this.country();
    }, this);
As you can see, this metricChange value is not a normal knockout.js binding, but a computed one. In other words, our view will be updated whenever either the country element changes (e.g when the model is loaded) or when the metric (the dropdown) changes. This way we can easily let a view respons to changes in more than one element of our view. The binding code itself, uses d3.js once again for rendering the map.
// custom handler to draw the complete map
ko.bindingHandlers.d3svg = {
    init:function (element, valueAccessor, allBindingsAccessor, viewModel) {
        // we don't do anything on initialize
    },
    update:function (element, valueAccessor, allBindingsAccessor, viewModel) {
        // if we've got a filled json object with geo information
        // we use it to drawn the complete country
        if (typeof viewModel.country() != "undefined" &&
            typeof viewModel.selectedCity() == "undefined") {

            // remove everything, for the total map, we render directly
            // to a svg element.
            d3.select(element).selectAll("g").remove();

            // based on whether we've got a selected metric, we run a quantize function
            // on the values. To do this we first need to calculate the max and min
            // values. We also store the metric values directly in a map for easy reference
            var qMin, qMax, metrics = {};
            if (viewModel.selectedMetric() != null) {
                console.log(viewModel.selectedMetric());
                for (i = 0; i < viewModel.country().cities.length; i++) {
                    var metricValue = viewModel.country().cities[i].getPropertyValue(viewModel.selectedMetric());
                    var parsed = parseInt(metricValue);
                    if (i == 0) {
                        qMin = parsed; qMax = parsed;
                    } else {
                        if (parsed < qMin && parsed >= 0) qMin = parsed;
                        if (parsed > qMax) qMax = parsed;
                    }
                    metrics[viewModel.country().cities[i].code] = parsed;
                }
            }

            // draw the map, and color the fields based on the metrics
            drawMap(element, metrics, qMax, qMin);


            // if we've got a metric selected, render a legend
            if (typeof viewModel.selectedMetric() != "undefined" || viewModel.election().selectedParty() != null) {
                // draw the legend
                drawLegend(element, qMin, qMax)
            }
        }
    }
};
In this part of the binding we check whether the values are as we expected, and if so we determine the mininum and maximum value of our metric. We do this to determine how to draw the legend, and how to distribute the values along these colors. The actual drawing of the map and the legend is done in the drawMap and the drawLegend functions.
function drawMap(element, metrics, qMax, qMin) {

    d3.select(element)
        .append("g")
        .attr("id", "countryMap")
        .attr("class", appConstants.COLORBASE)
        .selectAll("path")
        .data(viewModel.country().geojson)
        .enter().append("path")
        .attr("d", geo.path)
        .attr("class", function (d) {

            if (viewModel.selectedMetric() != null) {

                var metricValue = metrics[d.gm_code];
                // we have a range of qMin to qMax, which should be divided
                // into 8 equal steps.
                // (value - qMin + qMax) / 8
                var range = qMax - qMin;
                var calcValue = metricValue - qMin;

                return "q" + Math.min(8, ~~(calcValue / (range / 8))) + "-9";
            }
        })
}
This is d3.js code that renders a map based on geojson. The class element of the svg path we add, the contours of a single city, is determined by the function we provide. This function distributes the value of the selected metric into 8 pieces. So depending on the value a contour gets assigned a class in the form of q2-9 or q3-9 etc. The names of values of the required classes are provided by a colorbrewer css file. This file contains ranges of colors you can use to colorize maps (or other graphs):
.PuBu .q0-8{fill:rgb(255,247,251)}
.PuBu .q1-8{fill:rgb(236,231,242)}
.PuBu .q2-8{fill:rgb(208,209,230)}
.PuBu .q3-8{fill:rgb(166,189,219)}
.PuBu .q4-8{fill:rgb(116,169,207)}
.PuBu .q5-8{fill:rgb(54,144,192)}
.PuBu .q6-8{fill:rgb(5,112,176)}
.PuBu .q7-8{fill:rgb(3,78,123)}
The drawLegend isn’t a very interesting method. This just uses basic svg constructs to draw a simple legend:
// draw a legend
function drawLegend(element, qMin, qMax) {
    // create a new group with the specific base color and add the lower value
    d3.select(element)
        .append("g")
            .attr("id", "legenda").attr("class", appConstants.COLORBASE)
        .append("text")
            .attr("x", "20").attr("y", "40").text("Min: " + Math.round(qMin*100)/100);

    // add the various blocks of the legenda
    d3.select(element).select("#legenda").selectAll("rect")
        .data(d3.range(0, 8))
        .enter()
        .append("rect")
            .attr("width", "20").attr("height", "20").attr("y", "0")
            .attr("class", function (d, i) {
                return "q" + i + "-9";
            })
            .attr("x", function (d, i) {
                return (i + 1) * 20;
             });

    // add a text element
    d3.select(element).select("#legenda").append("text")
        .attr("x", "140").attr("y", "40").text("Max: " + Math.round(qMax*100)/100)
}
With this last legend we’ve discussed all the various parts of our first application. We’ve shown the part knockout.js plays in this and we’ve used d3.js to render svg elements. The last thing we do in this tutorial is setting up a basic bootstrap layout. Bootstrap is a project from Twitter that allows you to easily create grid and flexible CSS based layouts. For this example I’ve used the following layout (full index.html without bindings):
<!DOCTYPE html>
<html lang="en">
<head>
    <title>Dutch Elections: Step 1</title>
    <!-- load externally used libraries -->
    <script type='text/javascript' src='libraries/jquery/jquery-1.7.2.js'></script>
    <script type='text/javascript' src='libraries/d3/d3.js'></script>
    <script type='text/javascript' src='libraries/d3/d3.geo.js'></script>
    <script type='text/javascript' src='libraries/knockout/knockout-2.0.0.js'></script>

    <!-- load boot strap styles -->
    <link href="libraries/bootstrap/assets/css/bootstrap.css" rel="stylesheet">
    <link href="libraries/bootstrap/assets/css/bootstrap-responsive.css" rel="stylesheet">

    <!-- load own styles -->
    <link href="css/style.css" rel="stylesheet">

    <!-- load colorbrewer styles -->
    <link href="css/colorbrewer.css" rel="stylesheet">

    <!-- From bootstrap, support for IE6-8 support of HTML5 elements -->
    <!--[if lt IE 9]>
    <script src="http://html5shim.googlecode.com/svn/trunk/html5.js"></script>
    <![endif]-->
</head>

<body>

<!-- use the bootstap fluid container -->
<div class="container-fluid">
    <div class="well-small">
        <h1>Election using Knockout.js, Bootstrap and d3.js</h1>
    </div>

    <div class="row-fluid">
        <!-- left column, contains the select options -->
        <div class="span3">
            <div class="well">

                <!--
                    Bind to cities view model. Show the name of the city element. Bind
                    the selected element to selectedCity. Has default element with value
                    'Choose...'
                -->
                <div data-bind="with: country">
                    ...
                </div>

                <!--
                    Bind to list of available metrics. Only do this, when
                    no city has been selected.
                -->
                <div data-bind="ifnot: selectedCity">
                 ...
                </div>
            </div>
        </div>


        <!-- right column shows the information -->
        <div class="span9">
            <div class="row">
                <!--If a city is selected, view the city-->
                <div data-bind="if: selectedCity" class="span9">
                    <div class="well">
                        ...
                    </div>
                </div>

                <div data-bind="ifnot: selectedCity" class="span9">
                    <div class="well">
                   ...
                    </div>
                </div>
            </div>

            <div class="row">
                <div data-bind="if: selectedCity" class="span9">
                    <div class="well">
                    ...
                    </div>
                </div>
            </div>

            <div class="row">
                <!--
                    this element is processed if a city is selected. This shows all
                    the properties of the selected city in a table
                -->
                <div data-bind="if: selectedCity" class="span9">
                    <div class="well">
                     ...
                    </div>
                </div>
            </div>
        </div>
    </div>
</div>


<!-- after the html is loaded, load the application and bind
     the variables. -->
<script type='text/javascript' src='js/app/election-constants.js'></script>
<script type='text/javascript' src='js/models/city.js'></script>
<script type='text/javascript' src='js/app/util-geo.js'></script>
<script type='text/javascript' src='js/app/util-json.js'></script>
<script type='text/javascript' src='js/app/election-bindings.js'></script>
<script type='text/javascript' src='js/app/election.js'></script>

<!-- finally load all the bootstrap assets -->
<script src="libraries/bootstrap/assets/js/jquery.js"></script>
<script src="libraries/bootstrap/assets/js/bootstrap-transition.js"></script>
<script src="libraries/bootstrap/assets/js/bootstrap-alert.js"></script>
<script src="libraries/bootstrap/assets/js/bootstrap-modal.js"></script>
<script src="libraries/bootstrap/assets/js/bootstrap-dropdown.js"></script>
<script src="libraries/bootstrap/assets/js/bootstrap-scrollspy.js"></script>
<script src="libraries/bootstrap/assets/js/bootstrap-tab.js"></script>
<script src="libraries/bootstrap/assets/js/bootstrap-tooltip.js"></script>
<script src="libraries/bootstrap/assets/js/bootstrap-popover.js"></script>
<script src="libraries/bootstrap/assets/js/bootstrap-button.js"></script>
<script src="libraries/bootstrap/assets/js/bootstrap-collapse.js"></script>
<script src="libraries/bootstrap/assets/js/bootstrap-carousel.js"></script>
<script src="libraries/bootstrap/assets/js/bootstrap-typeahead.js"></script>
</body>
</html>
I won’t go into too much detail on bootstrap yet. For this example we’ve only used a small part of what bootstrap offers. The only thing we used are:
- well-small class: nicely render the dropdown boxes
- row-fluid class: For a fluid two column layout. Left column, contains the drop down boxes. Right column the information
- span# class: to determine the size of a specific column and row
- well class: to nicely render the content in a grey area
- row class: renders a row inside a span# div
In the next articles we’ll spent more time on the features bootstrap offers us. If you want more information on the elements used, look at the layout section of bootstrap: http://twitter.github.com/bootstrap/scaffolding.html#gridSystem
That’s it for this tutorial. In the next tutorial we’ll introduce actual election results and use bootstrap to define the layout we’ll be using. We’ll also extend knockout.js with Sammy.js to handle url mapping for back/forward button support and show you more how you can use d3.js to render graphs and show information in interesting ways. If you want to look at all the source code, open up http://www.smartjava.org/examples/election/part1.html in your browser and look at the source code.