Backpressure in action with websockets and akka-streams
So in the previous article I showed how you could create a websocket server using akka-streams. In this follow up article we’ll look a bit closer on how backpressure works with websockets (and probably any TCP based protocol on top of akka). To show you this we’ll use the same setup as we did in the article on visualizing backpressure. There we used the following tools:
- akka-mon: Some monitoring tools for actors to send events about metrics.
- Statsd: Provides an UDP API to which akka-mon can send metrics. Statsd collects these metrics and can send them to systems such as graphite and influxdb.
- Influxdb: We use this to collect the various metrics.
- Grafana: Grafana can visualize the data stored in influxDB. We'll use this to create line graphs that show backpressure in effect.
In this article we won’t dive too much into the details, for more information look at the previous article (todo: link).
Where we left of
Let’s quickly look at (part of) the websocket server we’ve created in the previous article:
To test backpressure, we use the /stats route, which we slighlt changed for this scenario. This route provides a set of stats through the following route:
You can see that this time we also pass in the request parameter ‘id’. We do this so that we can more easily see which flow on the server corresponds to a specific websocket client.
What we would like to see is that the actorPublisher we use here, will slow down sending messages if the client can’t keep up. Without going into the details of the actorPublisher, it used the following function to deliver its messages:
Note that it prints out when it has no more demand from the connected source (the websocket client in our case). So what we’d expect is that at a certain point we would see these kind of messages, when we have a slow client. To show whether backpressure works we’ll look at two different kinds of slow clients. Scenario one which has a fast connection, but takes excessive time processing the message, and scenario two where the message is processed immediately, but which uses a very slow connection. As a last scenario, we’ll run the first scenario, but this last time we connect a dozen clients.
Slow client 1: Client takes a lot of time processing the message
For this first scenario we use a simple scala based websocket client created using the Java Websocket library (link-to-github), which looks like this:
As you can see from this code, with can create a number of cliens at once (10 in this sample), which all connect to the websocket server. Note that we also pass on the id of the client, so we can correlate the client to the server events more easily, once we start creating the graphs with grafana and looking at the server log messages.
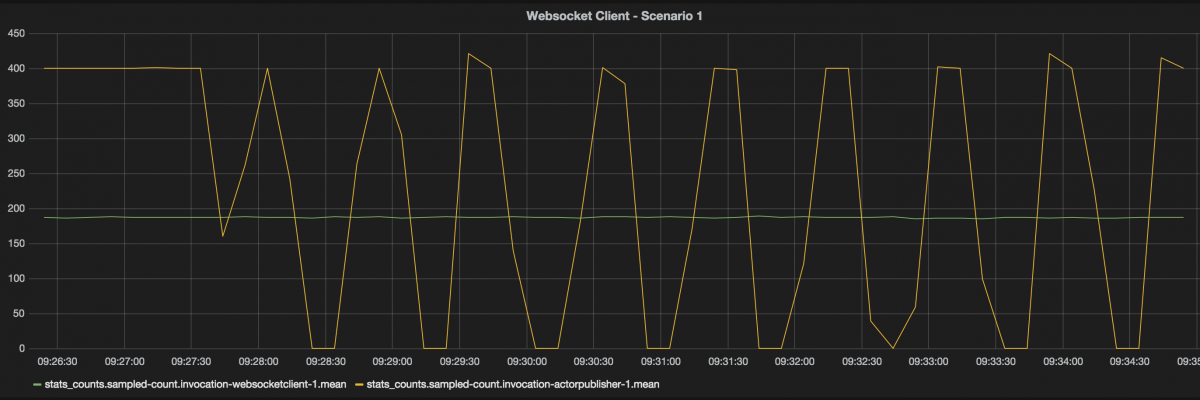
For our first scenario, we’ll just use a single websocket client, and see whether backpressure kicks in at the serverside. Running this with a single websocket client which consume 20 messages per second and a server which pushes 40 messages per second results in the following graph:

As you can see in this graph we process 200 msg in 10 seconds with the client, and 400 msg in 10 seconds are sent by the server. You can also see that at a certain point the server stops sending messages. This is when the backpressure kicks in. We can also see this in the log file of the server:
Adding to router: Actor[akka://websockets/user/$a/flow-3718-7-publisherSource-stageFactory-stageFactory-bypassRouter-flexiRoute-stageFactory-stageFactory-Merge-actorPublisherSource#1915924352]
No more demand for 1
No more demand for 1
No more demand for 1
No more demand for 1
No more demand for 1
No more demand for 1
So, even when the client doesn’t support the whole reactive streams itself, we can still profit from reative streams. The reason this works is because the TCP stack used by Akka-streams communicates back to akka-streams when it’s buffer is filling up. When that happens the TCP stack sends a msg to the publisher that it should stop sending messages. Once the TCP buffer is empty again, new messages are requested from the publisher. This isn’t really an exact science though, since the OS settings influence how much is bufferd. E.g for my laptop it is set to this:
net.inet.tcp.doautorcvbuf: 1
net.inet.tcp.autorcvbufincshift: 3
net.inet.tcp.autorcvbufmax: 1048576
net.inet.tcp.doautosndbuf: 1
net.inet.tcp.autosndbufinc: 8192
net.inet.tcp.autosndbufmax: 1048576
I don’t know the details about the BSD network stack, but assuming the buffer for this connection fills up to the max at both the receive and send buffer it will cache a large amount of messages. If we take 5KB per message and we have a total of 2MB of buffers to fill, there can be 400 messages buffered before backpressure kicks in. This is also something you see, when you look back to the previous image. In the beginning you see the publihser pushing out messages, without interruption. This is when the OS buffers are being filled up.
Slow client 2: Slow network connection, direct message processing
In the next scenario, let’s see what happens when we’ve got a client with limited bandwidth. To simulate this, we’ll use ip_relay (http://www.stewart.com.au/ip_relay/), which is a bit old, but provides a great and easy way to shape traffic and change the bandwith, while running the examples. Lets start ip_relay:
Joss-MacBook-Pro:ip_relay-0.71 jos$ ./ip_relay.pl 9002:localhost:9001
  Resolving address (localhost).....
  .... determined as: 127.0.0.1
Useing command line parameters:
  local_port	9002
  remote_addrs	127.0.0.1
  remote_port	9001
  bandwidth	0
  forwarder 99 set.


ip_relay.pl Version: 0.71
Copyright (C) 1999,2000 Gavin Stewart

Passive socket setup on 0.0.0.0:9002
>
Now we’ve got a local port 9002, which is forwarded to another localhost:9001 where our websocket server is listening. By default bandwidth isn’t throttled:
> show bandwidth
bandwidth	0
>
But we can set it using the following command:
> set bandwidth 1000
bandwidth	1000
This means we now have a throttled connection from port 9002 to port 9001 with a max bandwidth of 1kb. Now we change the ws-client to connect to localhost:9002. We can also use ip_relay to check whether it is working:
> sh stat
  Total connections: 1
  Bandwidth set to: 1000 bytes / sec.
  Forwarding connections for:
    127.0.0.1:56771 -> 127.0.0.1:9001 (CONN000001)
        Connection Up: 1 mins, 18 secs. Idle: 0 secs.
        Bytes transfered: 78000 in, 163 out.
        Data rate       : 0.98 kB/s in, 0.00 kB/s out.
            (5 sec avg.): 0.92 kB/s in, 0.00 kB/s out.
            (1 min avg.): 0.71 kB/s in, 0.00 kB/s out.
>
At this point we have a consumer with very limited bandwidth. Lets look at grafana and see how many messages per second it can process, and what our sender is doing:

As expected we see a very slow consumer, and a publisher which, after filling the buffer, stops sending. Now what happens when we turn the bandwidth limiter off?
> set bandwidth 0
bandwidth	0
> sh stat
  Total connections: 1
  Bandwidth is not set.
  Forwarding connections for:
    127.0.0.1:56771 -> 127.0.0.1:9001 (CONN000001)
        Connection Up: 5 mins, 38 secs. Idle: 0 secs.
        Bytes transfered: 520000 in, 163 out.
        Data rate       : 1.50 kB/s in, 0.00 kB/s out.
            (5 sec avg.): 23.08 kB/s in, 0.00 kB/s out.
            (1 min avg.): 3.31 kB/s in, 0.00 kB/s out.
The resulting graph looks like this:

You can see here, that the client starts processing many messages at once. These are the outgoing buffered message from the server. Once these are processed, the rates of the publisher and the client align. And when we turn the limiter back on, say to 3000 bytes per second:
> set bandwidth 3000
bandwidth	3000
> sh stat
  Total connections: 1
  Bandwidth set to: 3000 bytes / sec.
  Forwarding connections for:
    127.0.0.1:56771 -> 127.0.0.1:9001 (CONN000001)
        Connection Up: 10 mins, 18 secs. Idle: 0 secs.
        Bytes transfered: 3914379 in, 163 out.
        Data rate       : 6.19 kB/s in, 0.00 kB/s out.
            (5 sec avg.): 7.89 kB/s in, 0.00 kB/s out.
            (1 min avg.): 10.61 kB/s in, 0.00 kB/s out.
Backpressure once again kicks in (after filling the buffer):

The very nice thing about this is, that we don’t have to worry about slow clients, and slow connections hogging up resources. All messages are sent non-blocking and asynchronous, so we should be able to serve a very high number of clients, with limited CPU and memory resources.
As the last scenario, lets run scenario 1 again, but this time with multiple clients, each with there own random delay.
Slow client 2: Slow network connection, direct message processing
Lets fire up 10 web socket clients and see how the server responds. What we hope to see is that one slow client doesn’t affect the speed at which a fast client can process messages.
We configure the client like this:
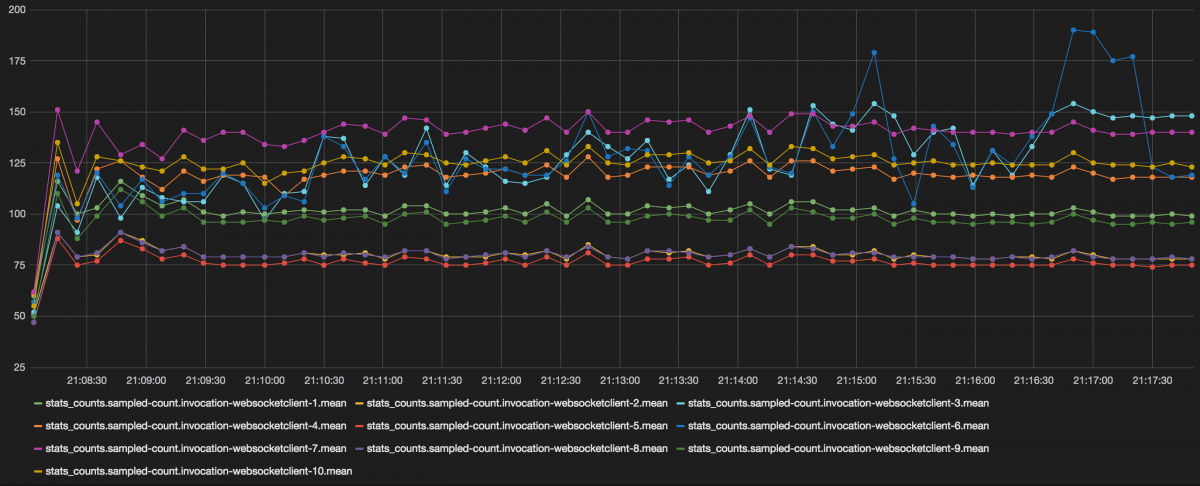
This means that we start 10 clients, that have a base delay of 50 ms and addd to that is a random delay of 1 to 100. Since we have a lot of lines and data points, lets first show the websocket clients message processing rates.

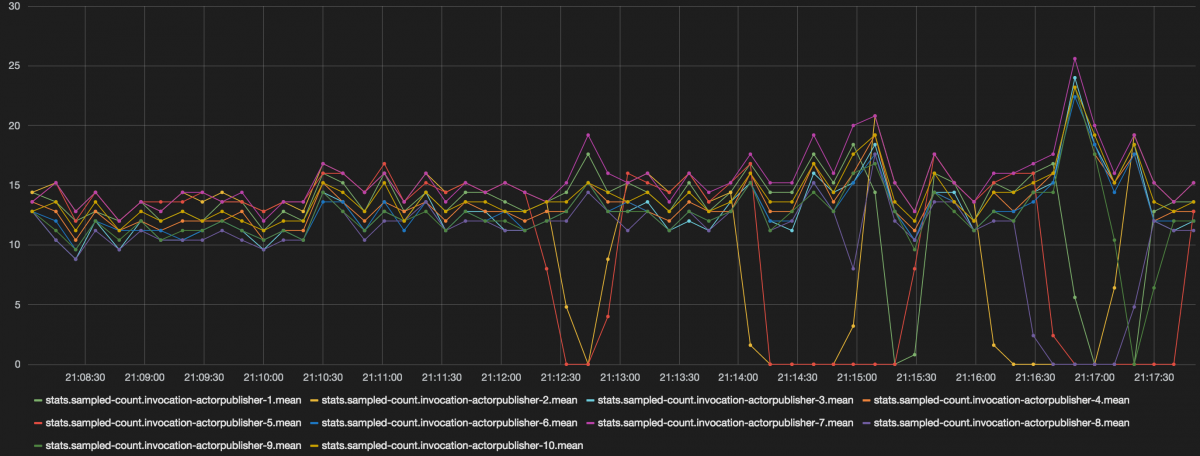
As you can see here we’ve got 10 listeners now, each receiving messages from our websocket server. Each also processes messages at a different speed. Now lets see what the server side is doing.

Here we see something very interesting. We see that there is a much closer correlation to the amount of messages sent and those processed (ignore the y-axis count), than we saw earlier. We can also see that, at a certain point, the demand stops completely for the two slowest subscribers.
So what can we conclude from all this. The main points, for me at least, are:
- You can use akka-streams not just within a VM, but also for backpressuring TCP calls.
- This works with websockets, but this would work as well with standard HTTP calls.
- You, however, need to keep in mind that on OS level, both on the receiver and sender side, you have to deal with TCP buffering. Depending on your OS, this can have a very big effect on when backpressure kicks in.
And, on a closing note, I just have to say that working with reactive streams, and more specifically akka-streams, feels like a very big step forward in creating responsive, scalable systems